31 May 2026
Data Literacy: Dimensions, Measures, and Information Marts
Key data literacy concepts every data professional should know — dimensions vs measures, information marts, and data modeling vocabulary.
Data
Data Literacy BI Data Modeling
Data literacy is the ability to read, understand, and communicate with data. These are the fundamental concepts.
Dimensions vs Measures
The most important distinction in data analytics:
| Concept | What It Is | Examples |
|---|---|---|
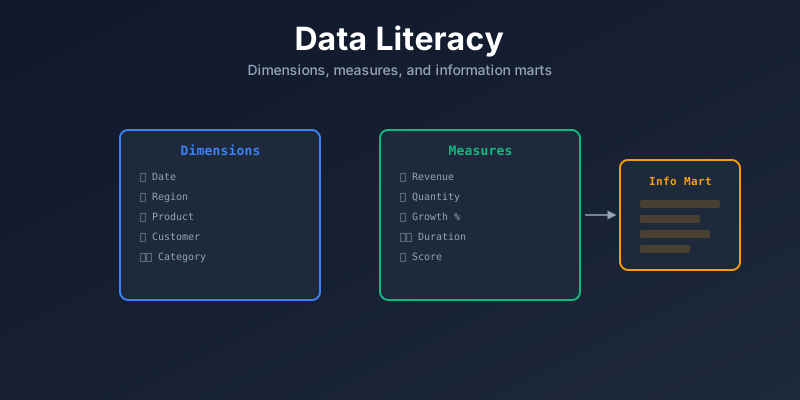
| Dimension | Descriptive attribute (the “by what”) | Date, Region, Product, Category |
| Measure | Quantitative value (the “what”) | Revenue, Quantity, Count, Average |
-- "Total revenue BY region BY year"
--   measure          dimensions
SELECT
    region,           -- dimension
    year,             -- dimension
    SUM(revenue)      -- measure
FROM sales
GROUP BY region, year;
Types of Dimensions
| Type | Description | Example |
|---|---|---|
| Descriptive | Static attributes | Product name, color |
| Time | Date/time periods | Year, quarter, month, day |
| Geographic | Location-based | Country, region, city |
| Hierarchical | Nested levels | Country → Region → City |
| Slowly Changing (SCD) | Changes over time | Customer address history |
Types of Measures
| Type | Description | Example |
|---|---|---|
| Additive | Can be summed across all dimensions | Revenue, quantity |
| Semi-additive | Can be summed across some dimensions | Account balance (sum across accounts, not time) |
| Non-additive | Cannot be summed | Ratios, percentages, averages |
Information Marts (Data Marts)
A data mart is a subset of a data warehouse focused on a specific business area.
Data Warehouse
├── Marketing Data Mart    ← campaign metrics, conversions
├── Finance Data Mart      ← revenue, costs, budgets
├── Sales Data Mart        ← orders, pipeline, quotas
└── HR Data Mart           ← headcount, turnover, hiring
Benefits:
- Faster queries (smaller dataset)
- Tailored to department needs
- Easier access control
- Simplified data models
Key Data Concepts
Grain
The level of detail in a fact table. Defined by the question: “What does one row represent?”
| Grain | Example |
|---|---|
| Transaction | One sale |
| Daily | Total sales per day per store |
| Monthly | Monthly revenue per product |
Rule: Define the grain first, then build the table.
ETL vs ELT
ETL: Extract → Transform → Load
     (source)   (staging)   (warehouse)

ELT: Extract → Load → Transform
(source) (lake) (in the warehouse)| Approach | When to Use |
|---|---|
| ETL | Transform before loading (traditional) |
| ELT | Load raw data, transform in warehouse (modern, cloud) |
Slowly Changing Dimensions (SCD)
How to handle dimension changes over time:
| Type | Strategy | Example |
|---|---|---|
| SCD 1 | Overwrite | Update current address (lose history) |
| SCD 2 | Add new row | New row with start/end dates (keep history) |
| SCD 3 | Add column | current_address + previous_address |
Data Quality Dimensions
| Dimension | Question |
|---|---|
| Accuracy | Is the data correct? |
| Completeness | Is all data present? |
| Consistency | Does the same data agree across systems? |
| Timeliness | Is the data fresh enough? |
| Uniqueness | Are there duplicates? |
| Validity | Does the data match expected formats? |
KPIs and Metrics
| Term | Meaning |
|---|---|
| Metric | A quantifiable measure (page views, revenue) |
| KPI | A metric tied to a business goal (conversion rate > 3%) |
| Leading indicator | Predicts future (website traffic) |
| Lagging indicator | Confirms past (quarterly revenue) |
Summary
| Concept | Key Idea |
|---|---|
| Dimension | The “by what” — categories for grouping |
| Measure | The “what” — numbers to aggregate |
| Data Mart | Subset of warehouse for one department |
| Grain | Level of detail (what does one row mean) |
| SCD | How to handle changes over time |
| ETL/ELT | Pipeline for moving and transforming data |